Multiple Choice
Figure 13-2
The figure depicts a total cost function for a firm that produces cookies.
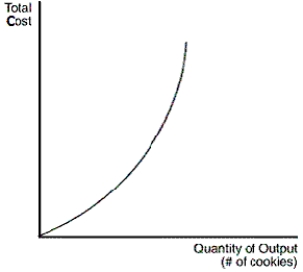
-Refer to Figure 13-2.Which statement describes the shape of the total-cost curve
Definitions:
Related Questions
Q20: Marginal cost increases as the quantity of
Q47: The Canadian federal government spends its revenues
Q66: Why do elephants face the threat of
Q98: How are explicit costs calculated<br>A)They require an
Q106: What is one of the most important
Q120: In recognition of the overfishing that resulted
Q134: Martavius faces a progressive federal income tax
Q145: Refer to Scenario 13-2.For the first year
Q147: Refer to Figure 14-9.What would likely cause
Q178: A firm is selling its product in