Use the figure below to answer the following question(s) .
Figure 4-7
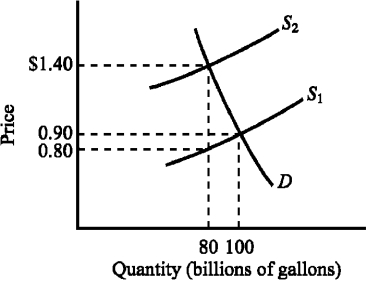
-Refer to Figure 4-7.The supply curve S₁ and the demand curve D indicate initial conditions in the market for gasoline.A $.60-per-gallon excise tax on gasoline is levied.How much revenue does the $.60-per-gallon tax generate for the government?
Definitions:
Physiological Change
Alterations in the normal functions of the body, which can be due to various factors including stress, disease, and environmental changes.
Emotional Episode
A sequence of emotional reactions occurring in response to a specific event or situation.
Vary
To change or alter in form, appearance, or nature, often in a slight way, leading to variations within a group or patterns.
Intensity
The quality or state of being intense; often refers to the degree or amount of strength, force, energy, or feeling.
Q15: According to the law of supply, as
Q46: Which of the following describes a situation
Q47: In the two decades following 1990, subsidized
Q74: An income tax is defined as regressive
Q127: If production of a good creates external
Q138: A sound legal system that protects individuals
Q144: If Kim can wash 10 cars or
Q155: Which of the following examples illustrates a
Q191: If the demand for a good is
Q204: Consider the market for grapes. An increase