Use the figure below to answer the following question(s) .
Figure 4-13
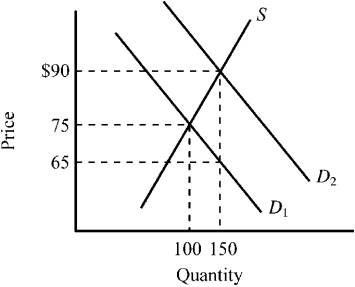
-Refer to Figure 4-13.The supply curve S and the demand curve D₁ indicate initial conditions in the market for flu shots.A new government program is implemented that grants buyers a $25 subsidy when they buy a flu shot,shifting the demand curve from D₁ to D₂.Which of the following is true for this subsidy given the information provided in the figure?
Definitions:
Free Money
Resources or funds received without the requirement for repayment, often perceived as grants or gifts.
Radio Station
A service that broadcasts audio content to the public through radio waves or digital transmissions.
Economic Analysis
Economic analysis involves examining data and using economic theory to understand and predict economic phenomena and inform decisions.
Personal Benefits
Advantages or gains received by an individual from their actions or investments.
Q11: Which of the following would most likely
Q28: If consumer tastes are changing more in
Q64: A price ceiling that sets the price
Q96: Which of the following statements is true?<br>A)The
Q97: Suppose that a tax is placed on
Q104: Suppliers recognize there is a shortage in
Q133: Middlemen, such as grocers, stockbrokers, and Realtors,<br>A)specialize
Q219: Why do economists use the concept of
Q220: In the orange market, what impact would
Q224: Which of the following are true?<br>A)Economists use