Figure 10-2
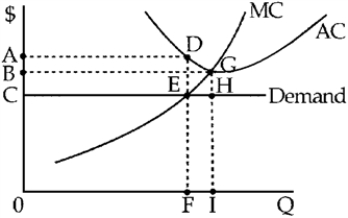
-Figure 10-2 shows demand and short-run cost curves for a perfectly competitive firm.At its profit-maximizing level of output, the firm's short-run TC is represented by area
Definitions:
Lock-Up Periods
A predetermined period following an initial public offering where major shareholders are prohibited from selling their shares.
Wealthy Investors
refers to individuals or entities that possess a significant amount of capital, often qualifying for exclusive investment opportunities and services.
Private Partnerships
A business organization owned by two or more individuals who share management and profits or losses.
Arbitrage Profit
Earnings generated by exploiting the price differences of identical or similar financial instruments on different markets or in different forms.
Q29: An individual with a diversified stock portfolio
Q44: A company may borrow money from<br>A)banks.<br>B)insurance companies.<br>C)other
Q45: In the long run, the perfectly competitive
Q91: All business firms should consider their fixed
Q109: A diversified portfolio only makes sense for
Q119: Assume Joe invests a total of $10,000
Q120: Bonds differ from stocks in all of
Q124: In the short run, perfectly competitive firms
Q184: Assume that you have taken over management
Q190: Regarding the relationship between marginal profit and