Multiple Choice
Figure 10-2
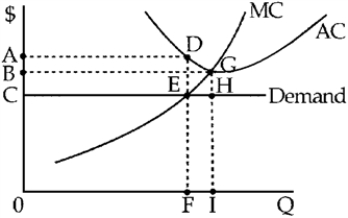
-Figure 10-2 shows demand and short-run cost curves for a perfectly competitive firm.At its profit-maximizing output, the firm's total ____ is represented by area ____.
Definitions:
Related Questions
Q15: In Figure 10-6, the price at long-run
Q29: Define the following terms and explain their
Q41: The key element in preserving a monopoly
Q43: In perfect competition, marginal revenue always equals<br>A)total
Q46: Using marginal analysis, explain why many restaurants
Q70: A firm sells in a competitive market
Q96: A futures contract is an agreement to
Q143: For legal purposes, a corporation is treated
Q180: For a monopoly, MC = MR <
Q207: When a firm leaves a perfectly competitive