Multiple Choice
Figure 8-2
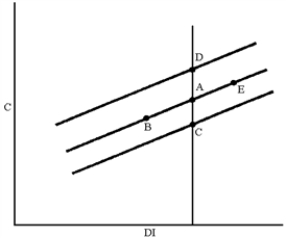
-In Figure 8-2, which of the following moves can be explained by an increase in government transfer payments?
Definitions:
Related Questions
Q3: Aggregate demand is a _ rather than
Q6: If aggregate quantity supplied exceeds aggregate quantity
Q24: The slope of the aggregate demand curve
Q42: If the price of pizzas has risen
Q47: The expenditure schedule includes the consumption function.
Q138: Which of the following groups would most
Q153: The major cost of production in the
Q174: The graph that relates hours of labor
Q186: Which of the following countries would find
Q206: Identify the "oversimplified multiplier formula."<br>A)Multiplier = 1