Figure 22-3
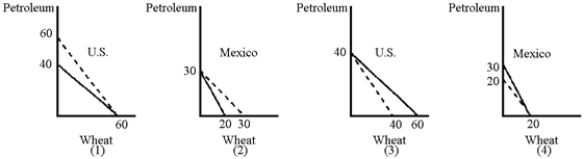
-In Figure 22-3, the solid lines represent the respective production possibilities curves for the United States and Mexico.Which graphs show the correct consumption possibilities curves (dashed lines) after an agreement is reached to trade 1 unit of wheat for 1 unit of petroleum?
Definitions:
Q15: American producers often complain about dumping.What is
Q15: In the rational expectations model, government control
Q28: On June 3, 2005, it cost 1.22
Q37: If actual inflation differs from expected inflation,
Q114: The purchasing power parity theory of exchange
Q116: In William Safire's 1983 essay, "Smoot-Hawley Lives,"
Q134: Appreciation is the term used to describe<br>A)the
Q135: International trade under a floating exchange rate
Q184: Purchasing power parity explains how exchange rates
Q214: If crowding out occurs, the Main Burden