Use the figure below to answer the following questions.
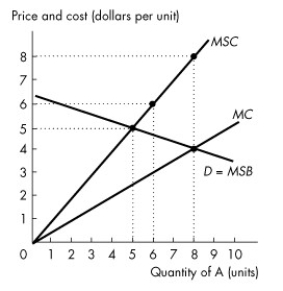
Figure 16.2.2
-Refer to Figure 16.2.2. This figure shows the demand curve, the marginal private cost curve and the marginal social cost curve of good A. What is the efficient quantity of good A?
Definitions:
Long-run Aggregate Supply Curve
A curve that shows the relationship between the overall price level and the quantity of output that all firms in an economy are willing to produce, assuming all resources are fully employed.
Monetary Policy
The process by which the central bank or monetary authority of a country controls the supply of money, often targeting an inflation rate to ensure economic stability.
Short-run Phillips Curve
A curve representing the inverse relationship between the rate of inflation and the rate of unemployment in an economy over the short term.
Money Supply Growth Rate
The rate at which the amount of money available in an economy is increasing.
Q9: Refer to Table 12.2.4. The market is
Q12: Household characteristics that stand out when determining
Q13: The market structure in which natural or
Q42: Consider the revenue and cost curves in
Q52: Which one of the following is not
Q85: Refer to Figure 14.2.3. Assume this firm
Q90: The slope of the production possibilities frontier
Q97: Rent seeking is best defined as<br>A)an attempt
Q103: Refer to Figure 14.2.6, which shows the
Q109: Refer to Figure 12.1.1. The firm competes