Use the figure below to answer the following questions.
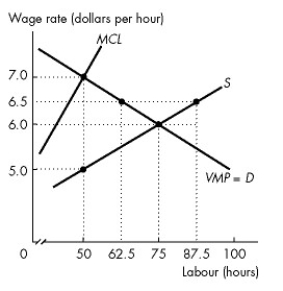
Figure 18.3.1
-Refer to Figure 18.3.1. This figure shows the value of marginal product of labour curve, the labour supply curve, and the marginal cost of labour curve. If a union and the monopsonist in Figure 18.3.1 are equally strong, the outcome will be an hourly wage
Definitions:
Substitution Effect
The change in consumption patterns due to a change in the relative prices of goods, leading consumers to replace more expensive items with cheaper alternatives.
Margin
Margin refers to the difference between the selling price of a good or service and its cost of production, also used to describe profit margin or markup.
Total Revenue Product
The total revenue generated by a factor of production, calculated by multiplying the marginal product of the factor by the market price of the output.
Marginal Revenue Product
The additional revenue generated from utilizing one more unit of an input, like labor or capital.
Q7: The most anyone is willing to pay
Q13: Refer to Fact 18.3.1. Labour unions are
Q25: In an oligopoly market, the Herfindahl-Hirschman Index
Q30: All games share four common features. They
Q40: Figure 17.3.2 shows the marginal private cost
Q53: Which of the following are true? The
Q59: In Figure 16.3.2. The figure shows the
Q61: In Figure 19.1.3, the second richest 20
Q71: Refer to Table 20.4.4. The table provides
Q101: Refer to Figure 16.3.1. The figure shows