Use the figure below to answer the following questions.
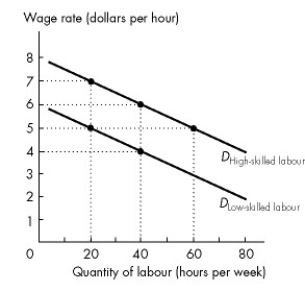
Figure 19.3.2
-Refer to Figure 19.3.2. At an employment level of 40 hours per week, the difference in the value of marginal product of high-skilled workers and low-skilled workers is
Definitions:
Demand Curve
a graphical representation showing the relationship between the price of a good and the quantity of that good consumers are willing to buy.
Cost Functions
Mathematical relationships expressing the cost of production as a function of the quantity of output produced.
Profit-maximizing
A strategy or point where a firm reaches the highest possible profit by balancing its costs and revenues.
Perfect Competition
A market structure characterized by many buyers and sellers, homogenous products, and free entry and exit from the market.
Q5: A recession is a period with<br>A)negative growth
Q17: Henelyn lost her job as a factory
Q51: Real GDP per person in the country
Q66: If the inflation rate is negative, the
Q67: Mr. Shaw has a small factory in
Q81: Refer to Figure 17.2.1. Curve MBA is
Q90: An income Lorenz curve<br>A)graphs the cumulative percentage
Q118: The concept of opportunity cost<br>A)cannot be explained
Q125: Refer to Figure 18.3.3. Suppose the government
Q156: Figure 2.1.3 illustrates Mary's production possibilities frontier.