Use the figure below to answer the following questions.
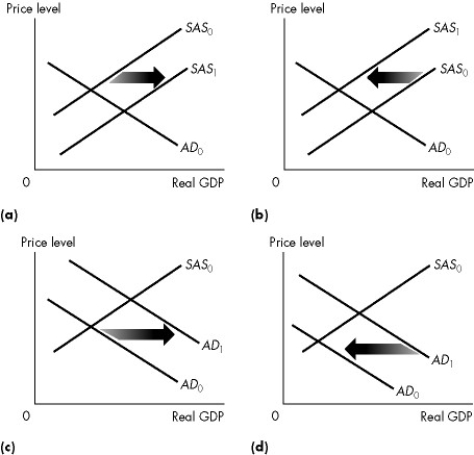
Figure 26.1.1
-Refer to Figure 26.1.1. Which graph illustrates what happens when factor prices decrease?
Definitions:
Social Programs
are organized efforts or initiatives by governments or organizations designed to improve the welfare of individuals or communities, often focusing on health, education, or social services.
Q14: An increase in autonomous expenditure shifts the
Q36: Consider all the effects of fiscal policy.
Q59: Refer to Table 26.3.3. With no interference
Q63: Consider Table 23.2.2. If planned investment increases
Q69: Refer to Figure 26.3.3(a). You might expect
Q70: If capital per worker increases, labour productivity<br>A)decreases
Q76: All of the following will raise the
Q84: Which one of the following is a
Q91: When would the exchange rate rise the
Q117: For a given real exchange rate, a