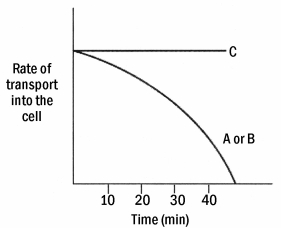
The graph below shows the rate of transport for each substance when the cells are placed in 0.10 mM solutions of A,B,and C.Based on these data and coupled with the data observed above,substance C is transported via ________.
Definitions:
Connectivity
The state of being connected or interconnected, often referring to the ability of devices or systems to link with each other through communication paths.
Q1: Synthetic compounds that inhibit receptors by preventing
Q2: An example of indirect active transport is<br>A)Na⁺/K⁺
Q9: Matter and energy flow through the biosphere.The
Q20: The sweetener aspartame is a known excitotoxin.With
Q29: During receptor-mediated endocytosis,the ultimate fate of the
Q35: Of the following cell types,the greatest concentration
Q39: To have a hormone receptor system that
Q47: Prokaryotes have _S ribosomes with _S and
Q51: You are wanting to modify plant cells.With
Q54: Cell biology emerged from which of the