Multiple Choice
Table 2.1.1
The following table gives points on the production possibilities frontier for goods X and Y.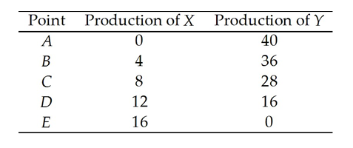
-The diagram of the production possibilities frontier corresponding to the data in Table 2.1.1 would be
Definitions:
Related Questions
Q13: If we observe an increase in the
Q18: _ is described by Miles et al.as
Q33: Refer to Fact 2.4.1. The opportunity cost
Q36: The working-age population is the total number
Q42: If the market for Twinkies is in
Q47: Some sales managers are talking shop. Which
Q63: To disentangle cause and effect, economists use
Q109: The labour force participation rate is<br>A)the percentage
Q138: Refer to Table 3.1.1. Between 2013 and
Q155: Which one of the following topics does