Use the figure below to answer the following questions.
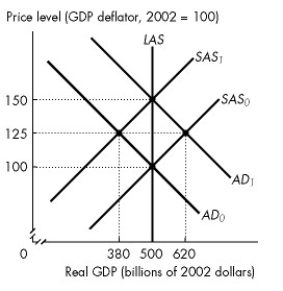
Figure 28.2.3
-Refer to Figure 28.2.3. Assume that the figure illustrates an economy initially in equilibrium at the intersection of the SAS₀ curve and the AD₀ curve. If the aggregate demand curve is correctly expected to shift to AD₁, new equilibrium real GDP is ________ and the new equilibrium price level is ________.
Definitions:
Acquisition Cost
The total expense incurred to acquire an asset, including the purchase price and all related costs.
Inventory Stock
Goods or materials that a business holds for the ultimate goal of resale.
Reorder Point
The inventory level at which action is taken to replenish a particular stock item, ensuring adequate supply while minimizing holding costs.
Carrying Cost
An expense related to holding inventory, including storage, insurance, and obsolescence costs.
Q21: If the Bank of Canada sets a
Q64: Suppose the dollar-yen foreign exchange rate changes
Q67: Refer to Figure 26.3.3(a). You might expect
Q70: Suppose that investment increases by $10 billion.
Q113: Saskatchewan had more hospitals than Ontario, despite
Q121: Refer to Fact 25.4.1. What is the
Q134: Refer to Figure 26.3.1. Econoworld is at
Q135: The expansion of international trade, borrowing and
Q143: If aggregate planned expenditure is less than
Q147: Refer to Figure 1A.1.5.Which graph or graphs