Use the figure below to answer the following question. 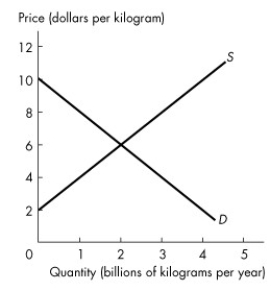 Figure 6.4.1
-Refer to Figure 6.4.1.The graph shows the market for tomatoes.When the government introduces a subsidy for tomatoes at $4 a kilogram,the quantity produced is ________ because ________.
Definitions:
Income Summary
An account used temporarily during the closing process to aggregate all income and expense accounts before transferring their balances to the retained earnings account.
Current Assets
Assets that are expected to be converted into cash, sold, or used within a year, including cash, inventory, and receivables.
Current Liabilities
Short-term financial obligations that are due within one year or within the normal operating cycle of a business, whichever is longer.
Current Ratio
A liquidity ratio that measures a company's ability to pay short-term obligations by comparing current assets to current liabilities.
Q1: Suppose we observe a fall in the
Q13: Chuck and Barry have identical total utility
Q24: Refer to Figure 9.3.4.Which graphs show the
Q25: The marginal cost for Morgan's Marvellous Movies
Q35: Sally's Ski Shoppe maximizes total revenue when
Q69: Refer to Figure 7.3.1.With the tariff, Canadians
Q82: What is marginal utility?<br>A)the change in total
Q90: According to the fair rules view of
Q113: The initial budget equation for pop (p)and
Q186: If A and B are complements and