Use the figure below to answer the following question.
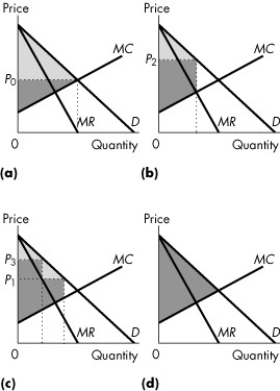
Figure 13.4.4
-Refer to Figure 13.4.4. Consider a market with a perfect price-discriminating monopolist. If the light grey area shows the consumer surplus and the dark grey area shows the producer surplus, which graph correctly represents this firm?
Definitions:
CAPM
Capital Asset Pricing Model, a theory used to determine the expected return on investment by correlating the risk of an asset to its expected return.
Exchange Rate
The rate at which one currency can be exchanged for another, usually used in the context of foreign exchange markets.
Firm's Beta
A measure of a company's stock volatility compared to the market as a whole, indicating its relative risk.
Profits
The financial gain realized when the amount of revenue gained from a business activity exceeds the expenses, costs, and taxes needed to sustain the activity.
Q20: A firm will want to increase its
Q21: What is a disadvantage of a corporation
Q21: Which one of the following is false?<br>A)The
Q29: Refer to Figure 12.2.2, which shows a
Q35: If the demand for its good or
Q39: Refer to Figure 16.3.1.The figure shows the
Q43: When Good A is produced, pollution is
Q64: Refer to Figure 11.4.4, which illustrates the
Q87: The shutdown point occurs at the point
Q114: Producing paper creates pollution.There is no externality