Use the figure below to answer the following questions.
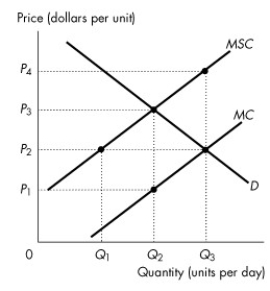
Figure 16.2.1
-Refer to Figure 16.2.1. The figure shows the marginal private cost curve, the marginal social cost curve and the market demand curve. If a constant per unit tax is imposed that generates an efficient allocation of resources, then consumers pay a per unit price of
Definitions:
Q17: In 2011, the poorest 20 percent of
Q20: A firm will want to increase its
Q32: Refer to Fact 14.3.2.Tommy Hilfiger uses advertising
Q34: In the price range above minimum average
Q56: Refer to Figure 14.2.7.The figure shows the
Q62: Refer to Fact 15.2.1.What is the Nash
Q77: Refer to Figure 13.2.1.This single-price monopoly produces
Q117: Refer to Figure 13.4.2.Assume this monopolist practises
Q180: The idea that the demand for tire
Q231: The low-income cutoff level is<br>A)a level of