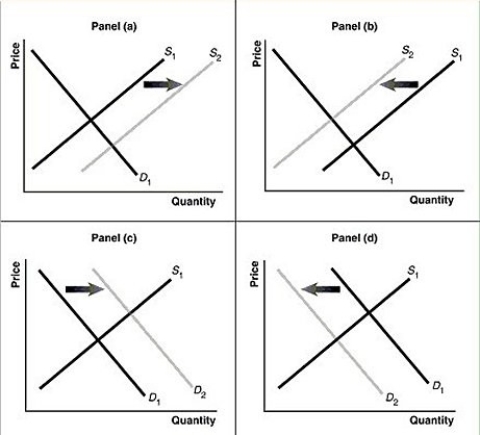
Figure 3-7

-Refer to Figure 3-7.Assume that the graphs in this figure represent the demand and supply curves for Fruitopia, a soft drink.Which panel describes what happens in the market for Fruitopia when the price of Snapple, a substitute product, decreases?
Definitions:
Q99: Marginal benefit is equal to the _
Q108: Suppose that in Canada the government places
Q108: Which of the following displays these two
Q113: Suppose a tax equal to the value
Q122: Refer to Table 2-1.Assume Tomaso's Trattoria only
Q161: Which of the following would cause the
Q194: Refer to Table 4-6.The equations above describe
Q222: If the demand for a product increases
Q226: Refer to Figure 2-7.Assume a technological advancement
Q237: Refer to Figure 2-3.Sergio Vignetto raises cattle