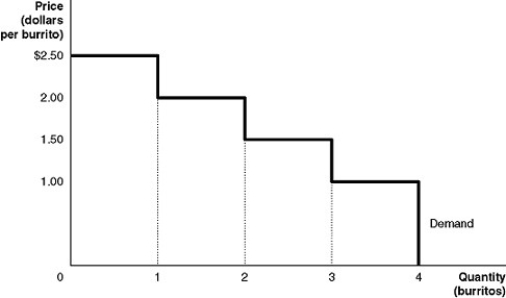
Figure 4-1

Figure 4-1 shows Arnold's demand curve for burritos.
-Refer to Figure 4-1.Arnold's marginal benefit from consuming the third burrito is
Definitions:
Corporate Restructuring
The process of significantly changing a company's business model, organizational structure, or financial structure, often in response to financial pressures.
Horizon Value
The estimated value of a company or investment at the end of a specific period, taking into account future cash flows or income it will generate.
Weighted Average
A calculation that takes into account the varying degrees of importance of the numbers in a data set.
Cost Of Capital
The minimum yield a firm needs to generate from its investment endeavors to sustain its market valuation and appeal to investors.
Q5: What is a private benefit from consumption?
Q27: Marginal cost is the additional cost to
Q60: If the price of grapefruit rises, the
Q68: If the number of firms producing mouthwash
Q91: In the past the federal government often
Q101: The private cost of a good or
Q201: According to the production possibilities model, if
Q204: Refer to Figure 3-8.The graph in this
Q207: The income effect explains why there is
Q213: If the demand for a product increases