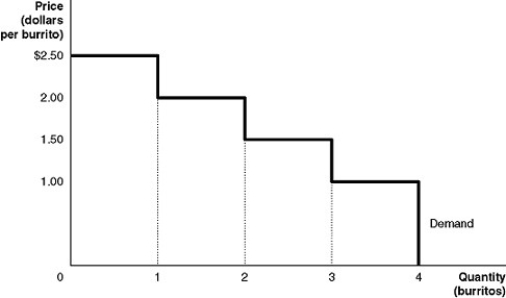
Figure 4-1

Figure 4-1 shows Arnold's demand curve for burritos.
-Refer to Figure 4-1.If the market price is $2.00, what is Arnold's consumer surplus?
Definitions:
Logarithmic Scales
Logarithmic scales are a way of displaying data on graphs where the scale is divided according to orders of magnitude, so each step on the scale represents a tenfold change in the data.
Marginal Revenue
The increase in revenue that results from the sale of one additional unit of product or service.
Demand Curve
A graph depicting the relationship between the price of a good or service and the quantity demanded for a given period, typically showing a downward slope from left to right.
Price Elasticity
A measure of how much the quantity demanded of a good responds to a change in its price, with elasticity indicating responsiveness.
Q2: If equilibrium is achieved in a competitive
Q25: The demand curve for a public good
Q73: Refer to Figure 5-4.Why is there a
Q79: What are transactions costs? Why do transactions
Q85: Which of the following statements about a
Q101: Let D = demand, S = supply,
Q152: Any output combination along a production possibilities
Q156: At a price of $20, Daphne sells
Q182: Refer to Figure 4-8.How much of the
Q185: If there is a market outcome in