Multiple Choice
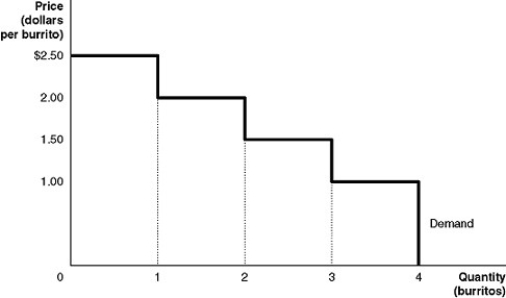
Figure 4-1

Figure 4-1 shows Arnold's demand curve for burritos.
-Refer to Figure 4-1.If the market price is $3.00, what is the maximum number of burritos that Arnold will buy?
Definitions:
Related Questions
Q1: Refer to Table 2-11.If the two countries
Q5: Refer to Table 4-2.The table above lists
Q14: Refer to Figure 6-5.The section of the
Q23: Refer to Figure 4-4.The figure above represents
Q25: One would speak of a change in
Q89: A tax is efficient if it imposes
Q199: A tragedy of the commons occurs when
Q228: The Great Depression of the 1930s, with
Q230: Private producers have no incentive to provide
Q234: Which of the following describes how a