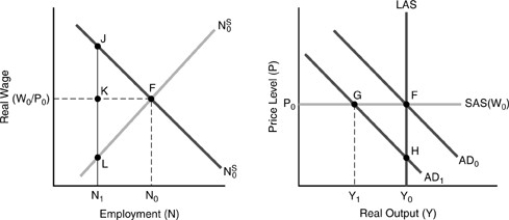
In Figure 17-4,below,initial demand,marginal cost,and marginal revenue curves (none of them shown) caused the firm to produce the profit-maximizing quantity Y₀ at a price of P₀.Now the demand and marginal cost curves have moved to those shown,with the marginal revenue curve running through point L.
Figure 17-4

-If the firm in Figure 17-4 above maintains its set price of P₀,rather than dropping price to P₁,the loss of consumer surplus due to this decision is
Definitions:
Q6: The _ of the 1968 tax surcharge
Q22: From the four asset bubbles discussed in
Q32: Given the level of real GDP,the equilibrium
Q33: If the MPS is 0.1 and the
Q42: In Figure 17-4 above,the profit-maximizing quantity,in the
Q45: A supply shock,such as the OPEC oil-price
Q82: We go from Gross to Net Domestic
Q100: Which of the following components of the
Q119: An adverse supply shock shifts the production
Q157: Classical macroeconomic theory was discredited and gave