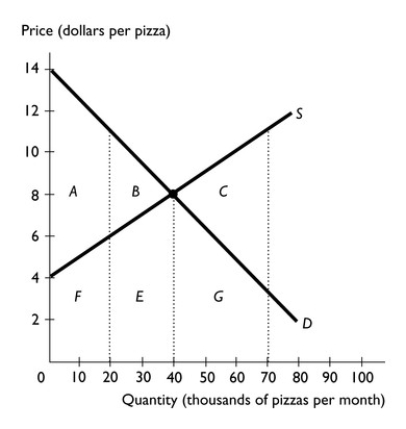
-The figure above shows the supply and demand for pizza.
a.What is the efficient level of output?
b.If 70,000 pizzas are produced,what area represents the deadweight loss?
c.Why does the deadweight loss in part (b)occur?
d.If 20,000 pizzas are produced,what area represents the deadweight loss?
e.Why does the deadweight loss in part (d)occur?
Definitions:
Yield-to-Maturity
The total expected return on a bond if the bond is held until its maturity date, considering all interest payments and the repayment of principal.
After Tax
Pertains to the amount of money left over or the value of transactions after all applicable taxes have been subtracted.
Perpetuity Rate of Return
The rate at which an infinite series of cash flows, received indefinitely, is discounted to equate its present value.
Stated Dividend
The amount of dividend that a company declares to be paid out to its shareholders, usually expressed as a fixed amount per share.
Q14: A regulation that sets the highest price
Q17: Maria helps tutor students taking economics.The equilibrium
Q69: After the tax is imposed, the price
Q107: The figure above shows the labor market
Q122: Which of the following leads to a
Q177: Rent ceilings<br>A)eliminate the problem of scarcity.<br>B)allocate resources
Q197: Which of the following is an example
Q231: Which of the following statements is correct?<br>I∙The
Q261: The elasticity of supply of capital is
Q277: Suppose a factory can be designed to