Multiple Choice
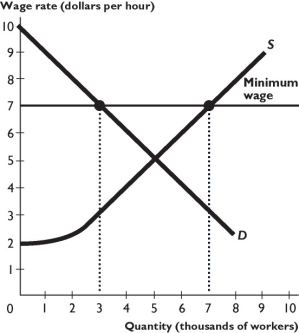
The figure above shows supply and demand in the market for labor. The government introduces a minimum wage of $7 per hour.
-In the figure above,the number of workers employed is ________,and the wage paid is ________.
Definitions:
Related Questions
Q12: A rent ceiling in a housing market<br>A)makes
Q43: The above figure shows a labor market
Q96: Based on the figure above, the burden
Q158: In the figure above, when 2,000 pizzas
Q201: Why does the marginal benefit curve have
Q219: To an economist, "value" is the same
Q220: The price of a cowboy hat is
Q237: Bill and Krista sell potted plants from
Q249: A tariff is<br>A)a tax imposed on imports.<br>B)any
Q254: If we look at the percentage of