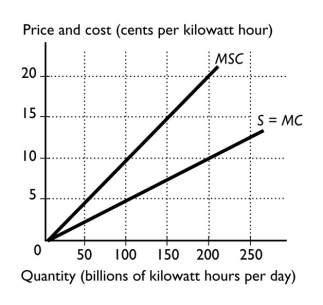
-The figure above shows the marginal social cost curve of generating electricity and the marginal private cost curve.The marginal external cost when 100 billion kilowatt hours are produced is
Definitions:
Importance
The state or fact of being of great significance or value.
"You" View
A communication perspective that focuses on and addresses the recipient directly, often used to create a more engaging or personalized message.
"I/we" View
The "I/we" view is a perspective in communication that emphasizes the use of first-person pronouns to create a personal or inclusive tone in messaging.
Submit Your Application
The act of formally presenting your credentials and interest for a position, enrollment, or permission, typically through forms or online platforms.
Q34: Vaccination against infectious diseases _ so private
Q85: Consider a social security tax on workers
Q87: What do we mean by "property rights"
Q116: Suppose that, after government imposed an income
Q133: Which would be a better source of
Q144: One important feature that distinguishes a private
Q185: Goods and services that the United States
Q187: The above figure shows the U.S.market for
Q196: In order for pollution taxes to be
Q210: If a polluting producer is forced to