Use the figure below to answer the following questions.
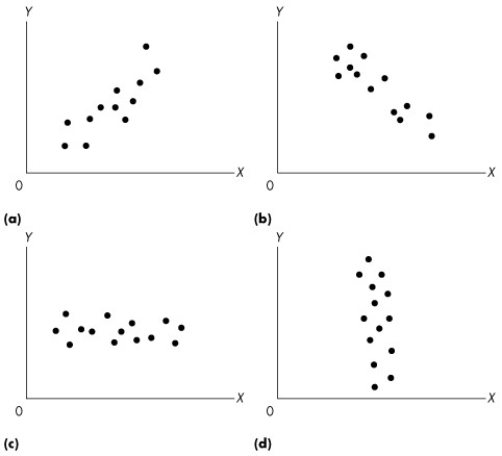
Figure 1A.1.5
-Consider graph (b) of Figure 1A.1.5. Which one of the following statements is true?
Definitions:
Isoquants
Curves representing combinations of inputs that result in the production of the same level of output, useful in production theory for understanding input substitutions.
Production Function
An equation describing the relationship between the inputs a firm uses and the output it creates, used in the analysis of production efficiency.
Isoquant Slope
Represents the rate at which one input can be substituted for another input while keeping the level of production constant, in the study of production theory.
Production Function
A mathematical model that describes the relationship between inputs (like labor and capital) and the maximum output that can be produced with those inputs.
Q16: Refer to Figure 28.1.4.The figure illustrates an
Q20: Refer to Figure 28.1.3.Assume that the figure
Q25: A/an _ quote in the United States
Q30: Most commodity prices rose in the first
Q30: A movement down along the short-run Phillips
Q48: Empirical studies show that the Fisher Effect
Q67: An inflationary gap is the amount by
Q69: Which of the following events would shift
Q81: Suppose there is an increase in exports.Assuming
Q82: According to the real business cycle theory,during