Use the figure below to answer the following questions.
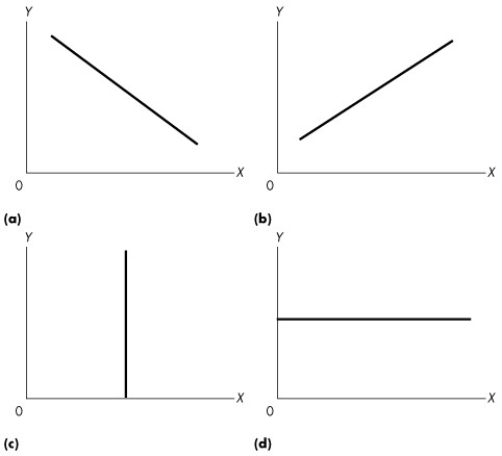
Figure 1A.2.3
-Refer to Figure 1A.2.3. Suppose our theory predicted that for low levels of quantity produced (x) a firm's profits (y) were low, for medium levels of output their profits were high, and for high levels of output their profits were low again. Which one of the graphs would represent this relationship?
Definitions:
Q9: Which one of the following can create
Q24: Which of the following is NOT a
Q30: Most commodity prices rose in the first
Q31: The balance of payments is most like
Q44: Swap and forward transactions account for an
Q50: Foreign currency options are available both over-the-counter
Q57: Refer to Instruction 8.1.The risk of strategy
Q75: Everything else remaining the same,an increase in
Q87: The main components of government revenues are<br>A)transfer
Q192: In Figure 1A.3.1,if household income increases by