Use the figure below to answer the following questions.
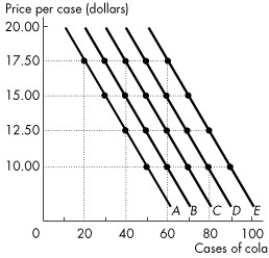
Figure 1A.4.5
-Consider the following information on cola sales by number of cases for a typical university residence floor:
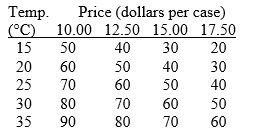
Refer to Figure 1A.4.5. Which line shows the relationship of cola sales and its price when the temperature is 30°C?
Definitions:
Q8: Peter Simpson thinks that the U.K.pound will
Q11: A currency board is<br>A)a structure, rather than
Q60: Discretionary fiscal policy<br>A)requires action by Parliament.<br>B)is triggered
Q61: A firm with variable-rate debt that expects
Q95: Refer to Fact 1.1.1.The cost of regenerating
Q96: Consider an economy starting from a position
Q138: A shift in the aggregate expenditure curve
Q159: The branch of economics that studies the
Q172: An economic model is<br>A)tested by examining the
Q187: To disentangle cause and effect,economists use economic