Use the figure below to answer the following question.
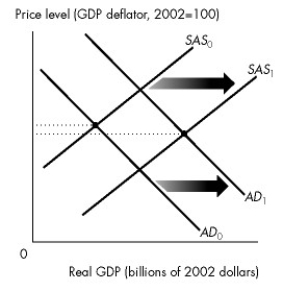
Figure 26.3.4
-Which of the following will lower the price level for sure?
Definitions:
Real Money Balances
The amount of money held by individuals or entities, adjusted for inflation.
Nominal Money Assets
Financial assets measured in monetary terms without adjustment for inflation, representing their face value at a point in time.
Price Level
A measure of the average prices of goods and services in an economy, indicating the purchasing power of money and the cost of living.
Aggregate Demand-Aggregate Supply Diagram
A graphical representation used in macroeconomics to illustrate the relationship between total demand and total supply in an economy.
Q2: As a percentage of provincial GDP,provincial government
Q20: Refer to Figure 28.1.3.Assume that the figure
Q24: When the Bank of Canada fights inflation
Q32: "Overshooting" exchange rate changes in response to
Q36: If the Bank of Canada wants to
Q57: The Federal Budget of 2011-12 projected _.<br>A)a
Q79: According to the real business cycle theory,what
Q85: In Figure 1A.2.2,the variables x and y<br>A)move
Q127: In an economy,autonomous spending is $20 trillion
Q131: The formula for the multiplier in an