Multiple Choice
Use the figure below to answer the following questions.
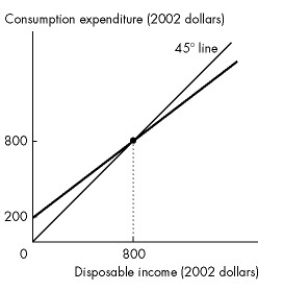
Figure 27.1.2
-Refer to Figure 27.1.2. Autonomous consumption is
Definitions:
Related Questions
Q6: It is safe to say that most
Q12: Table 31.2.1 shows the Canadian supply of
Q29: Consider graph (a)of Figure 1A.1.5.Which one of
Q30: In a market that moves from a
Q39: Refer to Figure 26.3.3.Which one of the
Q48: Refer to Figure 26.2.1.Which graph illustrates what
Q92: Refer to Table 26.3.2.The International Monetary Fund's
Q103: Table 31.1.1 shows Glazeland's doughnut market before
Q107: Refer to Figure 1A.2.3.Which one of the
Q122: If consumption is $8,000 when disposable income