Use the figure below to answer the following questions. 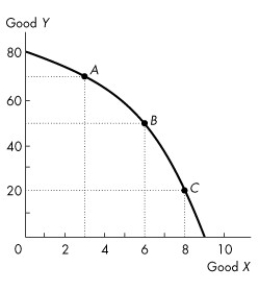 Figure 2.1.2
-Refer to the production possibilities frontier in Figure 2.1.2.At point A,the opportunity cost of increasing production of Y to 80 units is
Definitions:
Best Fit
A method or line that best approximates the relationship between variables in a set of data.
Minimizes
The process of finding the lowest value of a function, often relevant in optimization problems.
Residuals
The differences between observed and predicted values in a statistical model or analysis.
Actual Y Values
The observed values in a dataset or experiment that are compared against predicted values to assess model accuracy.
Q1: A hypothetical economy produced four final goods
Q21: Which of the following statements correctly describes
Q35: Table 31.1.1 shows Glazeland's doughnut market before
Q35: Which market is an example of a
Q58: If the saving function is S =
Q65: If the number of discouraged workers increases,everything
Q74: Refer to Figure 27.3.1.Autonomous expenditure equals<br>A)$100 billion.<br>B)$25
Q120: Which one of the following concepts is
Q125: Which of the following statements is true?<br>A)Final
Q138: A shift in the aggregate expenditure curve