Use the figure below to answer the following question.
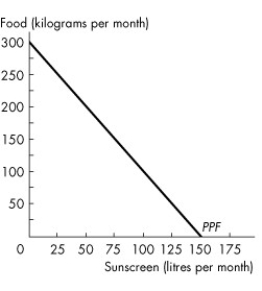
Figure 2.1.5
-The graph in Figure 2.1.5 shows Sunland's PPF for food and sunscreen.Sunland faces ________ opportunity cost of food and ________ opportunity of sunscreen,which can be seen by the shape of the PPF.
Definitions:
Supplier
An entity, individual, or company that provides products or services to another entity or individual typically in a supply chain context.
Income
Proceeds that come in, particularly at consistent intervals, from occupational or investment sources.
Utility Function
A mathematical representation that captures the preference ranking of various bundles of goods by an individual, translating these preferences into a level of utility or satisfaction.
Income
Refers to the money received, typically on a regular basis, for work or through investments.
Q4: Which of the following are valid reasons
Q6: Table 31.2.1 shows the Canadian supply of
Q32: Canada produces both lumber and wine.Canada exports
Q44: What is the Taylor Rule?<br>A)The overnight loan
Q67: Choose the correct statement.<br>A)Contractionary fiscal policy can
Q76: Which one of the following is true?<br>A)Y
Q97: If the CPI was 228 at the
Q108: Hyperinflation is defined as<br>A)declining inflation rates.<br>B)rising but
Q118: Refer to Fact 20.1.1.Peter's capital at the
Q147: When the price of good A rises,the