Use the figure below to answer the following question.
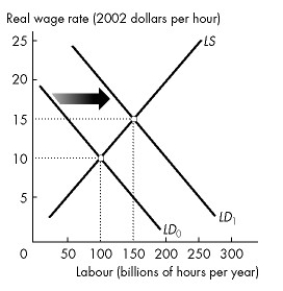
Figure 22.3.3
-Refer to Figure 22.3.3.As a result of the rightward shift in the demand curve for labour from LD0 to LD1,the equilibrium level of employment ________,potential GDP ________,and potential GDP per hour of labour ________.
Definitions:
Retention Ratio
The share of net income not disbursed as dividends to shareholders but rather reserved by the business for various uses.
Dividend Payout Ratio
The fraction of net income a firm pays to its shareholders in the form of dividends, compared to the portion reinvested in the business.
Percentage of Sales Approach
A method used in financial forecasting to estimate various elements of a financial statement as a percentage of forecasted sales.
Profit Margin
A financial metric that measures the amount of net income generated as a percentage of revenue, indicating how effectively a company can convert sales into net profits.
Q20: The Consumer Price Index measures inflation by
Q22: All of the following statements are true
Q28: Canada's balance of payments accounts are the<br>A)current
Q39: A turnip is an inferior good if<br>A)an
Q44: The gap between real GDP per person
Q55: Which one of the following would be
Q59: People react when they are being measured,and
Q84: The demand curve is P = 700
Q100: Choose the statement that is incorrect.<br>A)A chartered
Q135: The main functions of markets include<br>A)promoting the