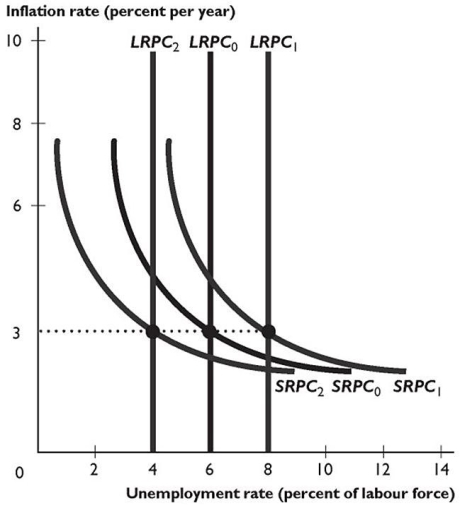
The figure above shows some Phillips curves for an economy.
-In the figure above,the shift from the short-run Phillips curve SRPC₀ and the long-run Phillips curve LRPC0 to the short-run Phillips curve SRPC2 and the long-run Phillips curve LRPC2 is the result of ________ in the expected inflation rate and ________ in the natural unemployment rate.
Definitions:
Scatterplot
A graphical representation using dots to show the relationship between two variables.
Self-Esteem
An individual's overall subjective emotional evaluation of their worth or personal value.
Depression
A common and serious mental health condition marked by persistent feelings of sadness, hopelessness, and a lack of interest in activities.
Normally Distributed
Describes a symmetrical, bell-shaped distribution of data where most values cluster around the mean.
Q13: Over the business cycle,factors such as the
Q35: As a result of importing a good,domestic
Q57: The government debt is the amount<br>A)by which
Q60: A country that is borrowing more from
Q62: In the long run,when the Reserve Bank
Q74: The table above gives data for the
Q103: If a tax cut increases aggregate demand
Q103: Suppose an economy experiences a permanent increase
Q134: If the price level increases from 110.0
Q161: When the multiplier is _,an autonomous decrease