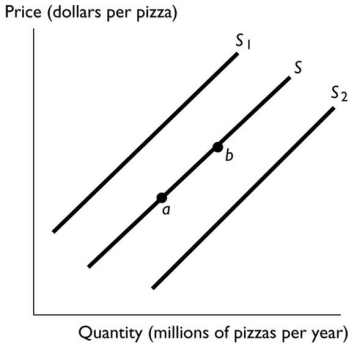
-In the above figure,the shift in the supply curve from S to S₁ reflects
Definitions:
Marginal Product
The supplementary yield achieved by the utilization of one additional unit of a variable factor, with all other resources remaining fixed.
Fixed Cost
Costs that do not vary with the level of production or sales, such as rent or salaries, over a relevant period.
Variable Cost
Refers to expenses that vary directly with the level of production or output, such as raw materials and labor costs.
Total Cost
The full price of manufacturing that incorporates both stable and changing expenses.
Q13: The business cycle is defined as<br>A)persistent growth
Q18: Investment is defined as<br>A)what consumers do with
Q39: In a competitive market,an individual _ has
Q51: Harry works at Video-Ezy for 20 hours
Q62: In the circular flow model with the
Q73: The production possibilities frontier is a graph
Q92: In the table above,Jack's opportunity cost for
Q101: When the total Australian production of goods
Q118: Based on the figure above,which of the
Q123: Using the data in the table above,the