Multiple Choice
Figure 21-3 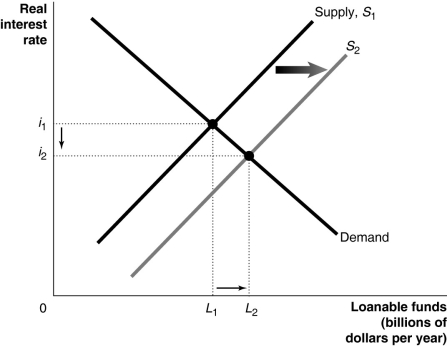
-Refer to Figure 21-3.Which of the following is consistent with the graph depicted above?
Definitions:
Related Questions
Q16: In the United States,the average length of
Q17: If labor productivity growth slows down in
Q22: A decrease in government spending will result
Q46: Starting from long-run equilibrium,use the basic aggregate
Q65: Using an aggregate demand graph,illustrate the impact
Q82: If Neal O'Danny preferred stock pays an
Q82: John Maynard Keynes argued that if many
Q97: Which of the following increases labor productivity?<br>A)
Q123: When the price of oil rises unexpectedly,the
Q137: Explain how a stock market crash has