Table 2-6
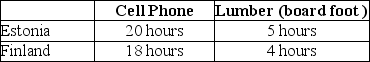
-Refer to Table 2-6. This table shows the number of labor hours required to produce a cell phone and a board foot of lumber in Estonia and Finland.
a.If each country has a total of 3,600 labor hours to devote to the production of the two goods,draw the production possibilities frontier for each country.Put "Cell Phone" on the horizontal axis and "Lumber" on the vertical axis. Be sure to identify the intercept values on your graphs.
b. Suppose each country allocates 55% its labor hours to lumber production and 45% to the production of cell phones.Complete Table 2-7 below to show each country's output of the two products.
Table 2-7: Production and Consumption with no Trade

c. If the two countries do not trade and consume whatever they produce,identify the current production and consumption point for each country on their respective production possibilities frontiers.Label Estonia's consumption point "E" and Finland's consumption point,"F."
d. Suppose the two countries specialize and trade.Who should produce cell phones and who should produce lumber? Explain your answer.
e. Complete Table 2-8 below to show each country's output with specialization.
Table 2-8: Output with Specialization

f. Did specialization increase the combined output for the two countries without any increase in resources? If so,by how much?
g. Suppose Estonia and Finland agree to trade so that in exchange for 400 board feet of lumber,the exporter of lumber receives 90 cell phones.Complete Table 2-9 below to show each country's consumption bundle after trade.
Table 2-9: Consumption with Trade

h.Show the consumption points after trade on each country's production possibilities frontier.Label these points "X" for Estonia and "Y" for Finland.
i.Has trade made the two countries better off? Explain your answer.
Definitions:
James II
King of England, Scotland, and Ireland who reigned from 1685 to 1688, his policies of religious tolerance toward Catholics led to the Glorious Revolution, which resulted in his deposition and the establishment of constitutional monarchy in Britain.
Nathaniel Bacon
led Bacon's Rebellion in 1676, an armed rebellion against the colonial government of Virginia, reflecting settlers' frustrations with Native American policies and governance.
Spanish
Pertaining to Spain, its people, culture, or language, which is a Romance language and the second most natively spoken language in the world.
Pueblo Rituals
Traditional ceremonies and practices of the Pueblo Indigenous peoples, deeply rooted in their spiritual beliefs, cultural heritage, and connection to the environment.
Q26: The graph below represents the market for
Q37: Juanita goes to the Hardware Emporium to
Q40: Imagine that you borrow $1,000 for one
Q59: For most goods and services,the burden of
Q59: The processes used to produce goods and
Q74: Refer to Figure 3-6. The figure above
Q101: The economic analysis of minimum wage involves
Q117: Which of the following would cause an
Q132: Unemployment caused by a business cycle recession
Q139: When voluntary exchange takes place,only one party