Multiple Choice
Use the following figure to nswer the question : 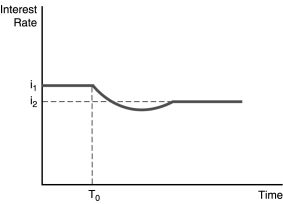
-The figure above illustrates the effect of an increased rate of money supply growth at time period T0. From the figure,one can conclude that the
Definitions:
Related Questions
Q5: The bond supply and demand framework is
Q5: Because information is scarce<br>A) helps explain why
Q40: Of the four sources of external funding
Q43: Both the CAPM and APT suggest that
Q57: Monetary aggregates are<br>A) measures of the money
Q59: Prior to all recessions,there has been a
Q77: Everything else constant,a stronger Canadian dollar will
Q89: Using the one-period valuation model,assuming a year-end
Q96: Everything else held constant,if the federal government
Q105: Everything else held constant,if income tax rates