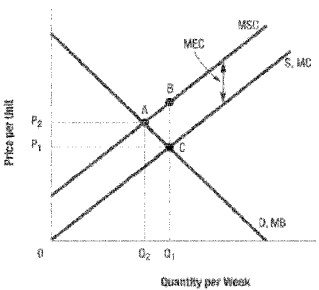
Use the following diagram to answer the following questions.
-Use the following diagram. The total net efficiency loss from government rent controls is given by area: 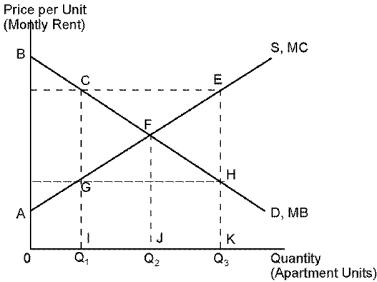
Definitions:
Supply Curve
A graphical representation showing the relationship between the price of a good and the quantity supplied by producers.
Minimum Point
The lowest point on a curve, often referring to the least cost or output level in various economic or mathematical models.
ATC Curve
The line that graphically represents the average total costs of production at various levels of output.
Purely Competitive
A market structure characterized by many small firms producing identical products, where no single firm can influence the market price.
Q8: Evaluate the following statement: "Government regulation should
Q9: Many people argue that legalization of drugs
Q15: Flooding in the Midwest causes much of
Q21: The production possibilities curve shows the maximum
Q36: Refer to Table 22.1. If Polaris increases
Q45: Allocative efficiency exists when net benefit is
Q52: Jennifer feels that adults should make their
Q55: What factors are the largest contributors to
Q103: Which of the following is the best
Q118: If demand for a product decreases, there