Multiple Choice
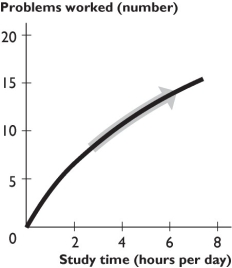
-The figure above shows the relationship between study time and the number of problems worked.The curve becomes less steep because as you study more,
Definitions:
Related Questions
Q15: Briefly explain how a child can obtain
Q24: It is acceptable to use food as
Q36: Ingredients in commercially jarred infant foods are
Q50: The figure above illustrates a small country's
Q127: When unskilled teens earn less than college
Q187: Gabriel operates a ranch in Idaho where
Q241: A time series graph<br>A) shows how a
Q269: A statement that argues that "if taxes
Q322: In order to make a rational choice,
Q345: A slope is measured as the<br>A) value