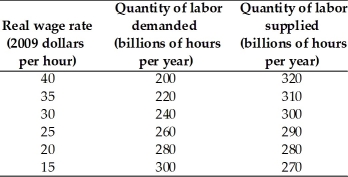
-The table above shows the labor demand and labor supply schedules for a nation.The equilibrium real wage rate is ________ and the equilibrium quantity of labor is ________ billions of hours per year.
Definitions:
Manufacturing Work Week
The average number of hours worked by employees in the manufacturing sector over a specified period.
Recession
A significant decline in economic activity spread across the economy, lasting more than a few months, typically visible in real GDP, real income, employment, industrial production, and wholesale-retail sales.
Metropolitan Chattanooga
A reference to the region surrounding Chattanooga, Tennessee, including its suburbs and nearby cities, often considered for demographic and geographic analysis.
T Distribution
A probability distribution used in statistics that accounts for the sample size in estimating the mean of a normally distributed population when the standard deviation is unknown.
Q13: The Bubby Gum factory produces bubble gum.Joanne
Q21: Nominal and real wage rates<br>A) must always
Q29: What factors can push the real wage
Q75: Choose which statement is most correct.<br>A) Real
Q114: For the world, what period of time
Q126: What three factors can increase aggregate hours?<br>
Q159: The supply of labor is defined as
Q179: Explain how the labor market and the
Q218: The CPI overstates inflation because the average
Q232: What is the difference between nominal variables