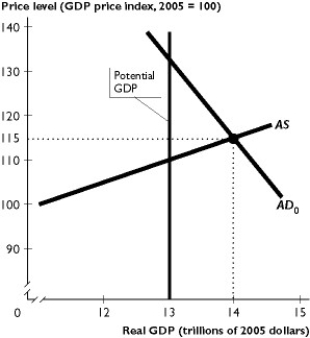
The figure above shows an economy's aggregate demand curve, aggregate supply curve, and potential GDP.
-In the figure above, the ________ gap is one trillion dollars. To close the gap, the government can change expenditure by ________ one trillion dollars.
Definitions:
Marketable Securities
Financial instruments that can be easily bought or sold on public exchanges or markets due to their high liquidity and short-term maturity.
Liquid Investments
Assets that can be easily converted into cash with minimal loss in value, ensuring quick accessibility of funds when needed.
Administrative Reason
A justification or explanation based on the requirements or procedures of management or bureaucracy.
Emergency Needs
Immediate financial requirements that arise unexpectedly, requiring quick access to funds.
Q6: Based on the above table, if the
Q18: Needs-tested spending<br>A) increases as real GDP increases.<br>B)
Q37: When the natural unemployment rate increases, the
Q45: If we look at the federal government
Q53: Along the short-run Phillips curve SRPC₀ the
Q71: Increasing the income tax rate _ the
Q105: The national debt is the amount<br>A) by
Q120: If the Fed increases interest rates, other
Q141: When the Fed worries about inflation, it
Q145: If the United States imposes a tariff