Multiple Choice
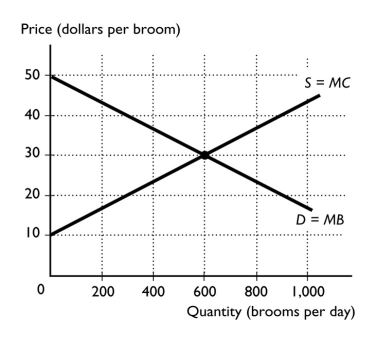
-The figure above shows the market for brooms.If 800 brooms are produced,
Definitions:
Related Questions
Q12: The demand curve for pizza is downward
Q94: Consumers' total benefit from consuming a good
Q132: The above figure shows the domestic market
Q148: Which of the following is an example
Q196: When the price of a pizza is
Q206: The figure above shows Kaley's marginal benefit
Q237: If the cross elasticity of demand between
Q253: The above figure shows the U.S. market
Q263: A tax<br>A)places a wedge between the price
Q269: When a country exports a good because