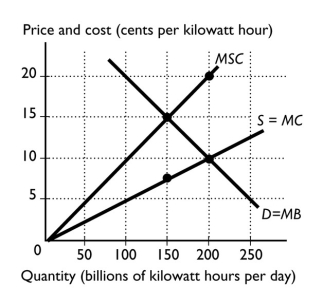
-The figure above shows the marginal social cost curve of generating electricity, the marginal private cost curve, and the demand curve. If the market is competitive and unregulated, the equilibrium quantity is ________ billions of kilowatt hours per day and the efficient quantity is ________ billion kilowatt hours per day
Definitions:
Productivity Targets
Specific goals set by an organization to measure and increase the efficiency of its outputs relative to inputs over a given period.
Job Structure
The relative pay for different jobs within the organization.
Pay Differential
Adjustment to a pay rate to reflect differences in working conditions or labor markets.
Unplanned Approach
A method lacking predetermined or systematic planning, often leading to spontaneous decision-making.
Q4: Jeremiah runs a bullfrog farm in Frogville,
Q7: From a firm's viewpoint, opportunity cost is
Q15: The marginal external cost and marginal private
Q55: What is "rent seeking"?<br> How does it
Q65: Which of the following is an argument
Q66: Vouchers given to consumers<br>A)increase the demand for
Q117: Jennifer owns a pig farm near Salina,
Q133: When a good is imported, the domestic
Q158: The main sources of economies of scale
Q273: If the United States negotiates a voluntary