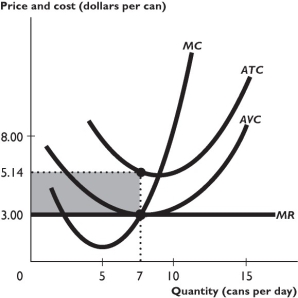
The above figure shows some a firm's cost curves and its marginal revenue curve.
-Suppose the price of a can was $5.14.In this case,to maximize its profit the firm illustrated in the figure above would
Definitions:
Geographical Adjustments
Adjustments made to policies, prices, or strategies based on the geographical location of markets or resources.
Discounts
are reductions from the usual cost of something, often used to prompt sales or as a negotiation tactic.
Allowances
Discounts or financial concessions given to customers, employees, or distributors as an incentive or for defective goods.
Cumulative Quantity Discounts
Price reductions applied to purchases based on the accumulated quantity bought over a specific time period, incentivizing larger orders.
Q54: In the figure above, if the firm
Q78: Average variable cost equals<br>A)fixed cost divided by
Q92: Which of the following statements is correct?<br>A)Any
Q99: Under which of the following conditions will
Q145: The long run average cost curve<br>A)is the
Q152: A cost incurred in the production of
Q201: In perfect competition, marginal revenue<br>A)increases as more
Q210: Based on the figure above, if the
Q212: A monopoly creates a deadweight loss because
Q314: In monopolistic competition, a firm can set