Use the following figure to answer the next few questions.
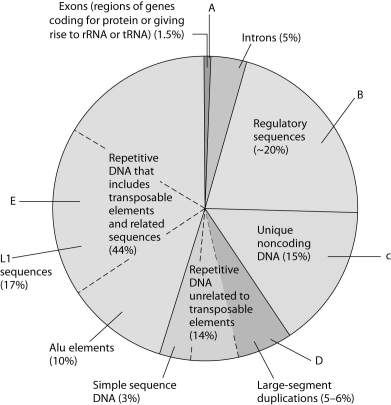
Figure 21.1 Types of DNA sequences in the human genome.
The pie chart in Figure 21.1 represents the relative frequencies of the following in the human genome:
I.repetitive DNA unrelated to transposons
II.repetitive DNA that includes transposons
III.unique noncoding DNA
IV.introns and regulatory sequences
V. exons
-Which region is occupied by exons only (V) ?
Definitions:
Productivity
The measure of the effectiveness of a person, machine, factory, system, etc., in converting inputs into useful outputs.
Quantitative Measure
An evaluation tool that uses numerical data to assess performance or outcomes.
Efficiency
The ability to accomplish a task or produce a desired outcome with the least amount of waste, effort, or resources.
Self-managers
Individuals who effectively regulate their own behavior and decisions towards achieving personal and professional goals.
Q2: A transcription unit that is 8000 nucleotides
Q9: Which mutation should least require realignment of
Q14: What is bioinformatics?<br>A)a technique using 3-D images
Q20: You are maintaining a small population of
Q23: Which of the following best describes the
Q44: Which of the following statements is (are)about
Q52: Based on the above table, which virus
Q64: What is the most reasonable conclusion that
Q65: What has happened to make the products
Q68: Assuming that the rate of sea-floor spreading