Use the figure below to answer the following question(s) .
Figure 4-7
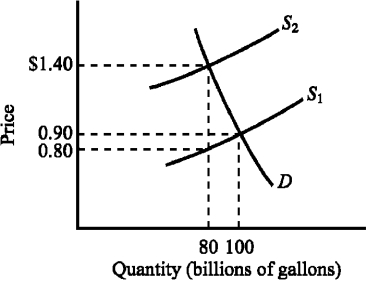
-Refer to Figure 4-7.The supply curve S₁ and the demand curve D indicate initial conditions in the market for gasoline.A $.60-per-gallon excise tax on gasoline is levied,which shifts the supply curve from S₁ to S₂.Imposing the tax causes the equilibrium price of gasoline to increase from
Definitions:
Automobile Risk Assessment
The process of evaluating the potential risks associated with insuring a particular vehicle, considering factors like model, age, and driver history.
Automobile Insurance
A policy purchased by vehicle owners to mitigate costs associated with getting into an auto accident.
Payment
The transfer of money or goods in exchange for a product or service.
Q45: A tax for which the average tax
Q45: Refer to Figure 3-21. At the quantity
Q61: Other things constant, a decrease in the
Q134: If the price of tickets to the
Q175: A decrease in supply will cause<br>A) an
Q186: If the quantity of a good supplied
Q186: Which of the following will most likely
Q188: If unemployment in the United States was
Q206: Use the table below to choose the
Q207: For a typical product, an increase in