After reading the paragraph below, answer the questions that follow.
The graph below shows records of temperature (light gray line) and CO₂ (dark gray line) over the past 1,000 years. CO₂ is recorded in parts per million (ppm) .
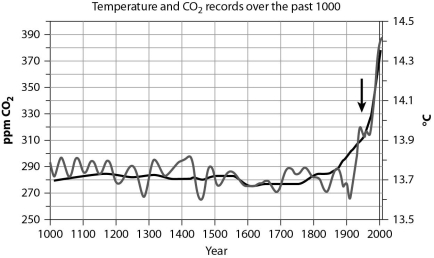
-Currently, atmospheric CO₂ levels are approximately 400 ppm. The annual mean growth rate in CO₂ is about 2 ppm/year. Assuming this trend continues, what would you predict the CO₂ level to be in 100 years?
Definitions:
Q1: Which of the following wavelengths of light
Q6: Which of the following lists structures involved
Q9: In the 1920s, Frederick Griffith conducted an
Q20: Tay-Sachs disease<br>A)causes an accumulation of lipids in
Q23: Respiration _, and cellular respiration _.<br>A)produces ATP;
Q24: According to _, energy cannot be created
Q25: A biologist interested in determining which plant
Q51: What force is responsible for the cohesiveness
Q59: A mature ovary, specialized as a vessel
Q70: The Calvin cycle constructs _, an energy-rich