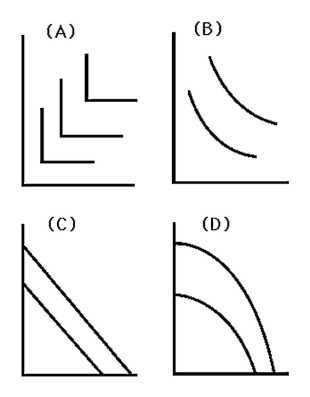
-Which graph in the above figure represents the isoquants where, as the amount of labor used increases and the amount of capital used decreases, the marginal product of labor rises (units of capital per day is on the vertical axis and units of labor per day is on the horizontal axis) ?
Definitions:
Profit Maximizing
A method where businesses determine the price and output level that returns the greatest profit.
Fuel Sources
Materials or substances used to generate power or energy, typically to produce heat, light, or to power engines.
Inputs
Resources used in the production process, including labor, technology, and materials.
Economies Of Scale
Situation in which output can be doubled for less than a doubling of cost.
Q15: What was GATT?<br>A) an international organization that
Q24: Openness to trade,rate of growth in GDP
Q25: The goodness of the fit of a
Q27: Pastoral nomadism,settled agriculture
Q27: Measuring "y" on the vertical axis and
Q52: In some markets,_ act to adjust the
Q58: Consumers allocate their budgets among bundles because<br>A)
Q73: The monopolist's marginal revenue curve<br>A) doesn't exist.<br>B)
Q80: When firms price discriminate they<br>A) get additional
Q82: The table in the above figure shows