Multiple Choice
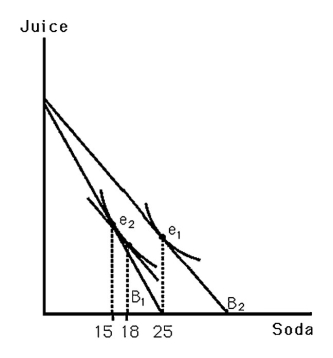
-The above figure shows Bobby's indifference map for soda and juice.B1 indicates his original budget line.B2 indicates his budget line resulting from an increase in the price of soda.From the graph,one can conclude that
Definitions:
Related Questions
Q9: During a mild winter,the price of home
Q27: If a competitive firm maximizes short-run profits
Q32: If the price of automobiles were to
Q40: At the XYZ Co.,a unit of capital
Q49: A production possibilities frontier that is a
Q60: If an increase in income results in
Q81: Assuming that w and r are both
Q82: Suppose a firm acts to minimize the
Q99: If the demand curve for comic books
Q107: The marginal rate of transformation of y